Online Portfolio Selection: Pattern Matching
Alex Kwon
Join the Reading Group and Community: Stay up to date with the latest developments in Financial Machine Learning!
Pattern matching locates similarly acting historical market windows and makes future predictions based on the similarity. They combine the strengths of both momentum and mean reversion by exploiting the statistical correlations of the current market window to the past.
In the following blog post, we will examine three variations of Correlation Driven Nonparametric Strategies strategies:
- Correlation Driven Nonparametric Learning
- Symmetric Correlation Driven Nonparametric Learning
- Functional Correlation Driven Nonparametric Learning
These strategies can further be improved by using the top-K selection process from the Universal Portfolio. By using an ensemble method, the aggregated portfolio reduces variability and can effectively choose the strategy with the highest returns.
We will be introducing the applications of these popular strategies with the ease of using PortfolioLab’s newest module. I hope that the newfound interests from these topics will spur more development as well as assist the research process for many others in the field.
Correlation Driven Nonparametric Learning (CORN)
Correlation Driven Nonparametric Learning strategies look at historical market sequences to identify similarly correlated periods. Existing pattern matching strategies attempt to exploit and identify the correlation between different market windows by using the Euclidean distance to measure the similarity between two market windows. However, the traditional Euclidean distance between windows does not effectively capture the linear relation. CORN utilizes the Pearson correlation coefficient instead of Euclidean distances to capture the whole market direction.
Correlation Driven Nonparametric Learning – Uniform (CORN-U)
Because the CORN strategies are dependent on the parameters, we propose a more generic one that takes an ensemble approach to reduce variability. One possible CORN ensemble is the CORN-U method.
CORN-U generates a set of experts with different window sizes and the same ![]() value. After all the expert’s weights are calculated, weights are evenly distributed among all experts to represent the strategy as a universal portfolio.
value. After all the expert’s weights are calculated, weights are evenly distributed among all experts to represent the strategy as a universal portfolio.
Correlation Driven Nonparametric Learning – K (CORN-K)
CORN-K further improves the CORN-U by generating more parameters of experts. There is more variability as different ranges of window and ![]() value are considered to create more options.
value are considered to create more options.
The most important part of the CORN-K, however, is the capital allocation method. Unlike CORN-U, which uniformly distributes capital among all the experts, CORN-K selects the top-k best performing experts until the last period and equally allocate capital among them. This prunes the experts that have less optimal returns and puts more weight on the performing ones.
Symmetric Correlation Driven Nonparametric Learning (SCORN)
Market symmetry is a concept that the markets have mirrored price movements. Increasing price trends represent a mirror of a decreasing trend. This gives us an intuitional understanding that if the price movements are strongly negatively correlated, the optimal portfolio weights should minimize the returns or the losses from those periods as it is most likely that the optimal portfolio weights would be the inverse.
Introduced recently in a Journal of Financial Data Science paper by Yang Wang and Dong Wang in 2019, SCORN identifies positively correlated windows and negatively correlated windows.
The positively correlated windows are identified the same way as for CORN, and the negatively correlated windows are identified as any that have a correlation value below the threshold, ![]() .
.
The strategy, therefore, maximizes the returns for periods that are considered similar and minimize the losses over periods that are considered the opposite.
Functional Correlation Driven Nonparametric Learning (FCORN)
FCORN further extends the SCORN by introducing a concept of an activation function. Applying the concept to the previous CORN algorithms, the activation function for the SCORN can be considered as a piecewise function. For any value between the positive and negative value of the threshold, we discount the importance of the period by placing a constant of 0.
Instead of completely neglecting windows with correlation with absolute value less than the threshold, FCORN introduces a sigmoid function that places a set of different weights depending on the correlation to the current market window. By replacing with such a variable, it is possible for us to place different importance on the correlated periods. One that has higher correlation will have higher weights of importance whereas ones that are less correlated will have less importance on it.
Data
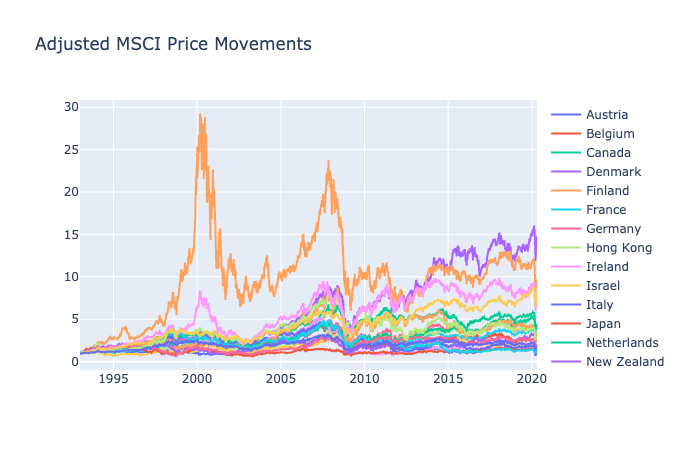
We will be using 6 different datasets, and if you would like to learn more about each dataset, exploratory analysis is available here.
- 36 NYSE Stocks from 1962 to 1984 by Cover
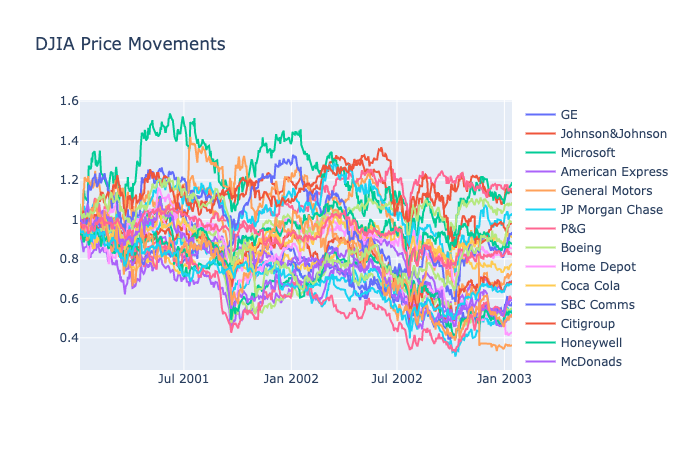
- 30 DJIA Stocks from 2001 to 2003 by Borodin
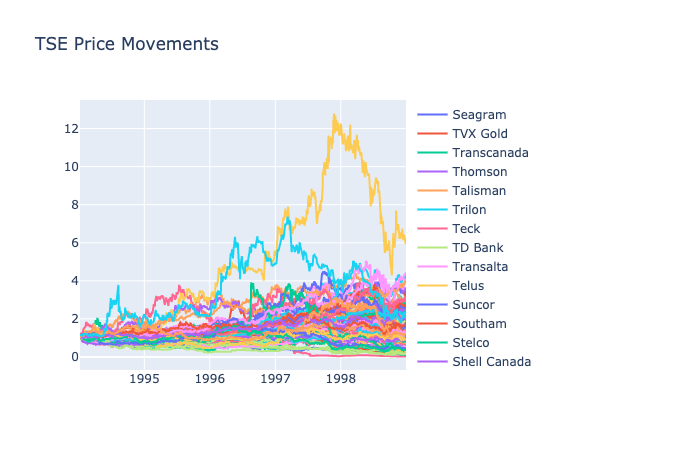
- 88 TSE Stocks from 1994 to 1998 by Borodin
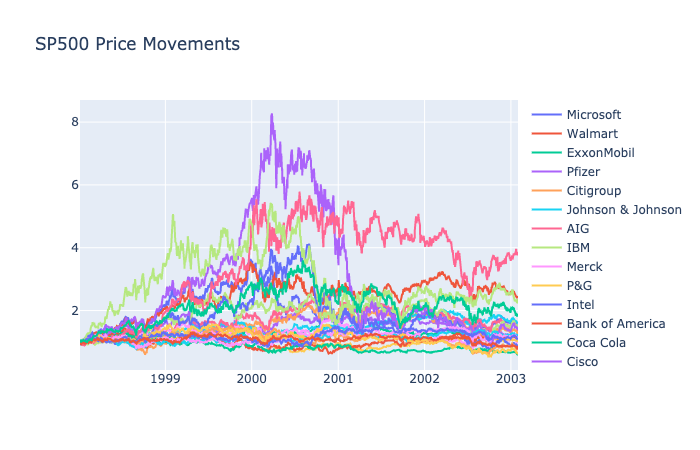
- 25 Largest S&P500 Stocks from 1998 to 2003 by Borodin
- 23 MSCI Developed Market Indices from 1993 to 2020 by Alex Kwon
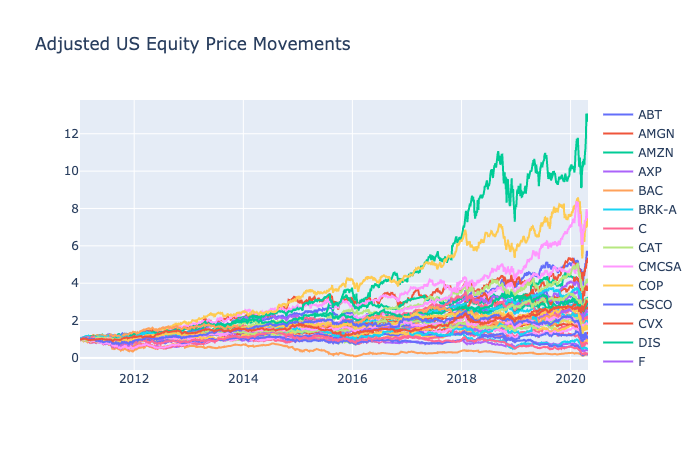
- 44 Largest US Stocks from 2011 to 2020 by Alex Kwon
We will be using Optuna to examine the effects of parameters.
NYSE: 1962-1984
There is an overwhelming concentration of parameters near a window of 1, which indicates that these pattern-matching strategies perform the best for a single period window. The optimal value of rho was near 0.4, and interestingly, we can see that returns are primarily dependent on the window length. It is certainly possible to reach extremely high returns with the right parameters, but a rho range between 0.2 and 0.4 was adequate for the most parts.
For the CORN-K, darker colors indicate higher returns. This ensemble strategy is primarily dependant on a low k value. The highest returns are from a window of 1 and rho of 3. This is in line with our CORN analysis that NYSE had a pattern matching the trend for a single period window, and rho of 3 covered value of ![]() , which is in range of the original optimal rho value.
, which is in range of the original optimal rho value.
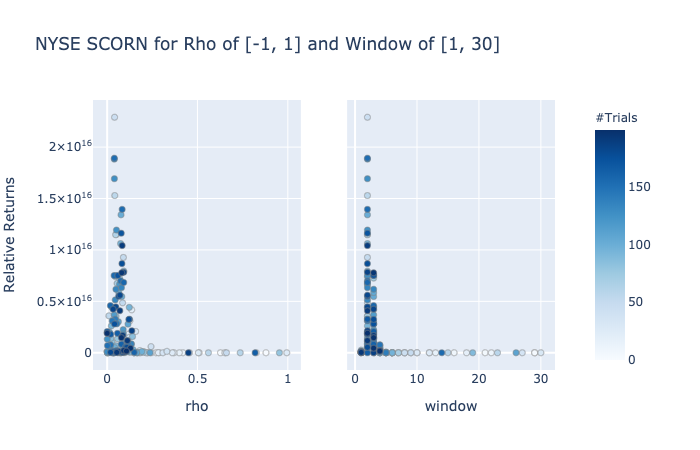
The SCORN algorithm actually provides a binary classification for the correlation threshold. Because the optimal rho is close to 0, the strategy indicates an activation function of 1 for correlated periods and -1 for inversely correlated periods. The market window is also slightly longer for SCORN as we see a price trend with a period of 2 corresponding to the highest returns.
Looking at the SCORN-K graph, we notice that a longer window was more optimal for SCORN, which is in line with our SCORN analysis. Because a lower rho and slightly longer window had higher returns, we see that the window of 3 and rho of 1 has the darkest spots as rho of 1 indicates an expert with a rho correlation value of 0.
The results for FCORN are completely different from the previous SCORN or CORN. There is a much higher optimal rho value, one that is closer to 0.8. The optimal window continues to stay the same as SCORN with a value of 3. With the lambd value of 1, a rho of 0.8 allows the strategy to effectively identify the periods with high similarity but also incorporate the information from periods that are less correlated.
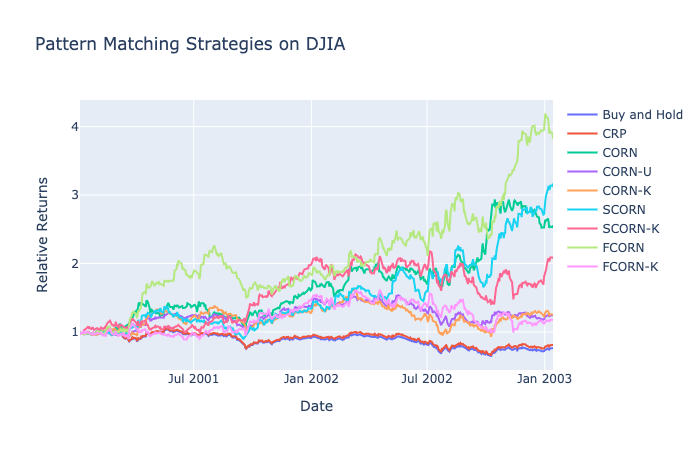
The results posted for NYSE are close to unbelievable as returns are in the magnitude of ![]() . Highest returns are posted from the resulting FCORN and SCORN algorithms, and the lowest returns were posted by the CORN-K with still an astonishing
. Highest returns are posted from the resulting FCORN and SCORN algorithms, and the lowest returns were posted by the CORN-K with still an astonishing ![]() . Further analysis of other datasets is needed to justify the usage of these algorithms as the NYSE may be an outlier.
. Further analysis of other datasets is needed to justify the usage of these algorithms as the NYSE may be an outlier.
DJIA: 2001-2003
The optimal rho value for DJIA is similar to NYSE’s 0.4; however, the biggest difference in the parameter value is the optimal window. We see the highest returns with a window 7, 8, or 9. This is longer than any of the other window parameters that we have seen so far.
Knowing that the optimal window for CORN is closer to 10, our current range of window of 1 to 5 for the CORN-K tests does not encompass the full potential. Different from NYSE’s CORN-K results, a lower value of K does not guarantee higher returns. In this case, a high rho value of 5 was the most important parameter as the range of correlation was needed to capture all possible variations of the strategy.
Similarly to the above CORN value, we see that the optimal window for SCORN is almost double of CORN’s window value. Window closer to 22 and 23 had the highest returns. For SCORN, rho of 0 continues to have the highest returns as the binary classification of historical market windows proves to be more effective.
Window range of 1 to 5 is suboptimal for SCORN-K as the optimal window range for SCORN is much higher at 22. Because the SCORN continues to prefer a binary classification regarding its similarity threshold, rho of 1 is sufficient to capture the highest returns as rho of 1 indicates a threshold at 0.
FCORN also has higher returns for window value near 22, and we actually see a different optimal rho value near 0.2. It is difficult, however, to say that there is only one best rho range as we see dark lines pass through a significant range of rho. Lambd of 1 continues to provide the highest returns for FCORN values.
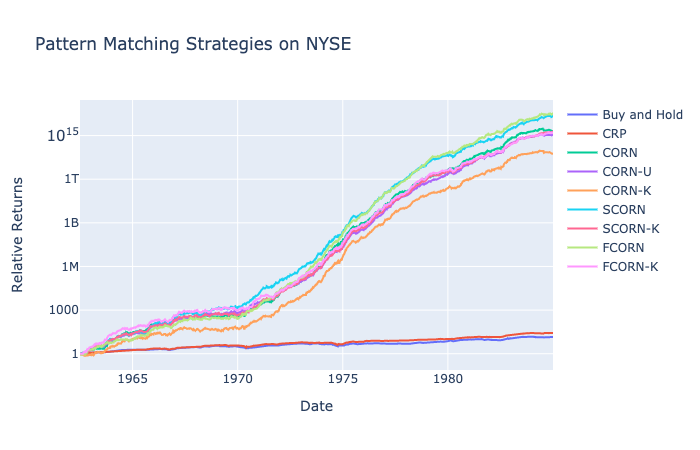
CORN performs significantly better than the benchmarks strategies for DJIA. This is a market with a continuous downtrend, and the current problem formulation only allows for a long-only portfolio. CORN is able to capture the patterns in these strategies as we see double and triple returns. SCORN-K and FCORN-K have lower returns due to the incorrect window range set by the initial testing phase. Preliminary results indicate that these CORN strategies can be applied for a market with a general bear run as well.
TSE: 1994-1998
The optimal rho for TSE is lower than the previous datasets with rho of 0.1, and the distribution of the window value for CORN does not indicate a clear, explainable pattern.
CORN-K represents the same pattern as the CORN strategy with a rho of 1 being the most optimal. All values of the window return similar darkness as window ranges fail to make a significant impact on returns.
Unlike for CORN, SCORN has a clear pattern with the optimal window value of 1. There is a higher concentration of values for a window of 1, and the best rho value is slightly off from 0 at 0.1. In fact, SCORN leaves out the market periods with a correlation near 0 by having the threshold slightly above the neutral value.
As the optimal value for the window is in the lower range at 1, the darker circles appear near a window of 1 for SCORN-K. Interestingly, the highest returns appear for a rho of 3 instead of 1. This is primarily because the optimal rho value is not exactly at 0, but a value between 0 and ![]() .
.
FCORN for DJIA displays similar patterns to the previous SP500. There is a wide range of optimal rho and a clear preference for low lambda and window value. If we had to pinpoint the optimal rho, a value of 0.7 would represent the median, which is in line with the previous optimal rho for FCORN.
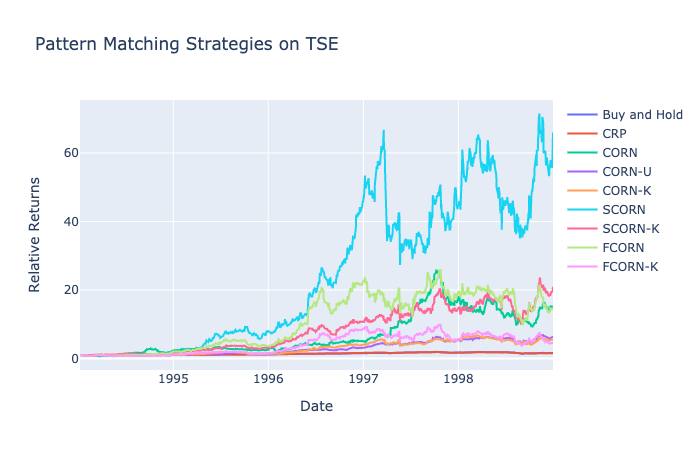
SCORN had significantly higher returns compared to other strategies with a sudden rise in 1996 3Q. Other strategies still fared well as we see returns close to 20 times the original value. We also see the biggest drawback of a capital growth portfolio here as well, with the huge drawdown near 1997 2Q and 1998 2Q. The algorithms optimize for maximum wealth rather than minimizing the risk.
SP500: 1998-2003
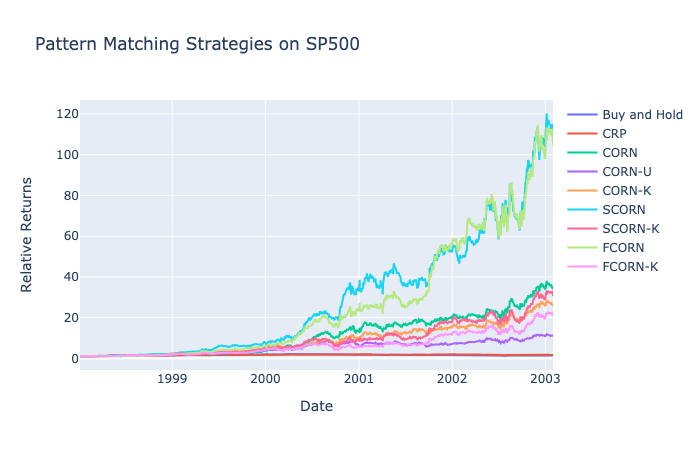
CORN strategies applied to SP500 indicate an interesting pattern as the optimal rho is right at 0. The strategy designated a time period as similar if the coefficient was non-negative. The optimal window value also has a clear result at 4 with the highest results reaching 35.
In line with the CORN applications, CORN-K displays the highest returns with an ideal rho of 1 and a window of 4.
As with other datasets, ideal rho is close to 0, and the best window value is at 5. Results for SCORN in fact reach close to 100, triple the results of CORN.
Any rho value that has a window of 5 displayed significantly higher returns for SCORN-K.
FCORN-K has the same optimal window value as SCORN-K at 5. Lambd continues to have higher returns at a lower value. The ranges for rho, however, are more divided as we see a clear segment at 0.2 and 0.6. It is difficult to explain how a rho of 0.2 would produce higher returns, but the value of 0.6 is in line with the previous results.
The tuned values for SCORN and FCORN reach returns of 120, and the more realistic application of SCORN-K and FCORN-K have returns that are close to 30. In an ideal scenario, the correct parameters should be identified to have high returns, but even if we do not have the exact values, the relatively high returns of SCORN-K and FCORN-K indicate a possibility of applications to a real trading environment.
MSCI: 1993-2020
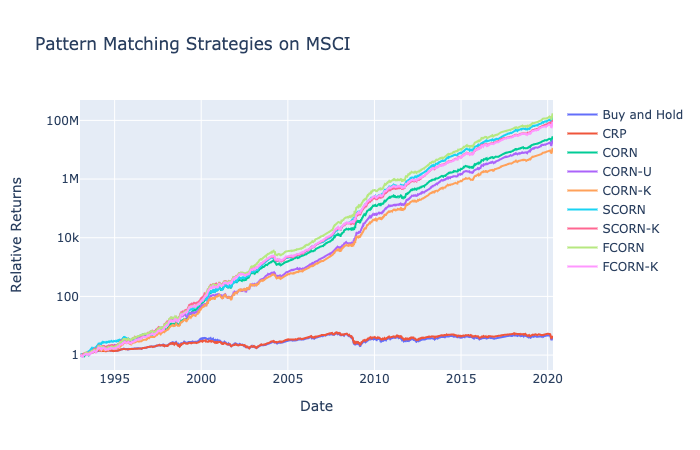
The returns for MSCI are also extremely high with applications with CORN. With a rho of 0.2, we see results that reach well above ![]() ; however, looking at the graph for CORN closely, we see that there is a slight segmentation between the 9 and 7 million returns. This might indicate that the results are extremely sensitive to your parameter choice.
; however, looking at the graph for CORN closely, we see that there is a slight segmentation between the 9 and 7 million returns. This might indicate that the results are extremely sensitive to your parameter choice.
With a rho value of 3 being the highest for CORN-K, we see a trend with the optimal selection of rho. For datasets with optimal rho value near 0.2. Rho of 3 represents the highest returns as the strategy can alternate between a rho of 0 and ![]() .
.
The SCORN results for MSCI are significantly different from previous sets. Rho of 0 is no longer the optimal as we see the value shifted to 0.2. Moreover, we see that the optimal window is 1, but if you take a closer look at the bottom values of window 1, there is a huge gap between 0 and 20M. A more detailed analysis of this phenomenon is required, but it is likely that for a window value of 1 a wider range of rho is accepted to produce similar returns.
In general, SCORN-K graph shows that as long as k is 1 most combinations have high returns. This most likely happens because the ideal window value is strictly 1, and therefore any combination of portfolios that have a parameter of 1 will have high returns.
Other than the overfitting SCORN and FCORN graphs, the other k-aggregated algorithms perform significantly better than the benchmarks. FCORN-K in fact is able to almost match the other two with SCORN-K and CORN-K closely following behind.
US Equity: 2011-2020
The CORN data with US Equity provides the most interesting results as this is directly applicable to a more modern timeline. Highest returns typically congregated around rho of 1 and a window of 2. In a way, the rho of 0 implies that any past history window with a non-negative correlation should be incorporated in the calculation, and a window of 2 indicates that a price trend should be looked at in a 2-day rolling window for correlation calculations.
CORN-K provides a similar analysis as CORN with a window of 2 and rho of 1 having the highest returns. Based on the darkness of the circles for all rho values of 1, we can also notice that most parameters with k values of 1 had significant returns.
There is less of a distinct pattern for SCORN. Rho of 0.2 is similar to MSCI but different from the other datasets. The window range is also much longer with a value closer to 16 being optimal. From the initial look, a more rigorous analysis should be required to determine the parameters and apply this strategy in a real trading environment.
The results for SCORN-K unfortunately do not mean much as we examined from SCORN that the optimal window is around 16, which is not covered in this range of values. The most important note from this graph is that k must be either 1 or 2 to have the highest returns for any ensemble of portfolios.
The graph for FCORN indicates a more robust strategy to exact parameters. A low value of lambd continues to produce high returns along with a wide range of rho from 0.6 to 1, and a window of either 1 or 2 had the highest returns, which is in fact different from the previously suggested values of CORN and SCORN for US Equity.
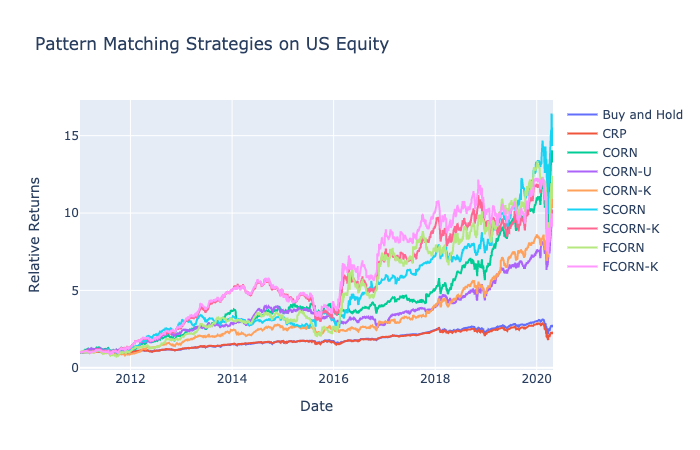
This US Equity dataset includes the recent downturn from COVID-19. Particularly, SCORN has its returns drop from 14 to 9 initially but regains its value back to 16. This is actually higher than the returns before the crash. Exact portfolio weights should be examined to determine the logic and pathway of the portfolio selection method, but these results indicate a possibility of applying pattern-matching strategies in a real trading environment.
Conclusion
Pattern matching strategies can be formulated in numerous ways with different thresholds and parameters. The original CORN development by Li, Hoi, and Gopalkrishnan was further improved with studies from Yang Wang and Dong Wang. This notebook covered a wide range of CORN strategies employed in PortfolioLab’s newest Online Portfolio Selection module, and readers will be able to replicate results using the simple methods of the new module.
If you enjoyed reading this please remember to leave us a star on GitHub and become a sponsor on Patreon to have exclusive access to our Slack channel!
Additional Reading
Reference
- Li, B. and Hoi, S.C.H., 2018. Online portfolio selection: principles and algorithms. Crc Press.
- Li, B., Hoi, S.C. & Gopalkrishnan, V., 2011. CORN: Correlation-Driven Nonparametric Learning Approach for Portfolio Selection. ACM Transactions on Intelligent Systems and Technology, 2(3), pp.1–29.
- Wang, Y. & Wang, D., 2019. Market Symmetry and Its Application to Pattern-Matching-Based Portfolio Selection. The Journal of Financial Data Science.


![NYSE CORN Rho [-1, 1] Window [1, 30]](https://hudsonthames.org/wp-content/uploads/2020/05/newplot-12-3.png)
![NYSE CORN-U Rho [-1, 1] Window [1, 30]](https://hudsonthames.org/wp-content/uploads/2020/05/newplot-13-3.png)
![NYSE CORN-K Window [1, 5] Rho [1, 5]](https://hudsonthames.org/wp-content/uploads/2020/05/newplot-14-3.png)
![NYSE SCORN-K Window [1, 5] Rho [1, 5]](https://hudsonthames.org/wp-content/uploads/2020/05/newplot-17-3.png)
![NYSE FCORN Lambd [0.1, 1000], Rho [-1, 1], Window [1, 30]](https://hudsonthames.org/wp-content/uploads/2020/05/newplot-16-4.png)
![DJIA CORN Rho [-1, 1] Window [1, 30]](https://hudsonthames.org/wp-content/uploads/2020/05/newplot-19-3.png)
![DJIA CORN-U Rho [-1, 1] Window [1, 30]](https://hudsonthames.org/wp-content/uploads/2020/05/newplot-20-3.png)
![DJIA CORN-K Window [1, 5] Rho [1, 5]](https://hudsonthames.org/wp-content/uploads/2020/05/newplot-21-3.png)
![DJIA SCORN Rho [-1, 1] Window [1, 30]](https://hudsonthames.org/wp-content/uploads/2020/05/newplot-22-3.png)
![DJIA SCORN-K Window [1, 5] Rho [1, 5]](https://hudsonthames.org/wp-content/uploads/2020/05/newplot-23-3.png)
![DJIA FCORN Lambd [0.1, 1000], Rho [-1, 1], Window [1, 30]](https://hudsonthames.org/wp-content/uploads/2020/05/newplot-24-3.png)
![TSE CORN Rho [-1, 1] Window [1, 30]](https://hudsonthames.org/wp-content/uploads/2020/05/newplot-26-4.png)
![TSE CORN-U Rho [-1, 1] Window [1, 30]](https://hudsonthames.org/wp-content/uploads/2020/05/newplot-27-4.png)
![TSE CORN-K Window [1, 5] Rho [1, 5]](https://hudsonthames.org/wp-content/uploads/2020/05/newplot-28-3.png)
![TSE SCORN Rho [-1, 1] Window [1, 30]](https://hudsonthames.org/wp-content/uploads/2020/05/newplot-29-2.png)
![TSE SCORN-K Window [1, 5] Rho [1, 5]](https://hudsonthames.org/wp-content/uploads/2020/05/newplot-30-2.png)
![TSE FCORN Lambd [0.1, 1000], Rho [-1, 1], Window [1, 30]](https://hudsonthames.org/wp-content/uploads/2020/05/newplot-31-2.png)
![SP500 CORN Rho [-1, 1] Window [1, 30]](https://hudsonthames.org/wp-content/uploads/2020/05/newplot-60.png)
![SP500 CORN-U Rho [-1, 1] Window [1, 30]](https://hudsonthames.org/wp-content/uploads/2020/05/newplot-1-4.png)
![SP500 CORN-K Window [1, 5] Rho [1, 5]](https://hudsonthames.org/wp-content/uploads/2020/05/newplot-2-4.png)
![SP500 SCORN Rho [-1, 1] Window [1, 30]](https://hudsonthames.org/wp-content/uploads/2020/05/newplot-3-4.png)
![SP500 SCORN-K Window [1, 5] Rho [1, 5]](https://hudsonthames.org/wp-content/uploads/2020/05/newplot-4-4.png)
![SP500 FCORN Lambd [0.1, 1000], Rho [-1, 1], Window [1, 30]](https://hudsonthames.org/wp-content/uploads/2020/05/newplot-5-4.png)
![MSCI CORN Rho [-1, 1] Window [1, 30]](https://hudsonthames.org/wp-content/uploads/2020/05/newplot-7-4.png)
![MSCI CORN-U Rho [-1, 1] Window [1, 30]](https://hudsonthames.org/wp-content/uploads/2020/05/newplot-8-4.png)
![MSCI CORN-K Window [1, 5] Rho [1, 5]](https://hudsonthames.org/wp-content/uploads/2020/05/newplot-9-4.png)
![MSCI SCORN Rho [-1, 1] Window [1, 30]](https://hudsonthames.org/wp-content/uploads/2020/05/newplot-10-3.png)
![MSCI SCORN-K Window [1, 5] Rho [1, 5]](https://hudsonthames.org/wp-content/uploads/2020/05/newplot-11-3.png)
![MSCI FCORN Lambd [0.1, 1000], Rho [-1, 1], Window [1, 30]](https://hudsonthames.org/wp-content/uploads/2020/05/newplot-12-4.png)
![US Equity CORN Rho [-1, 1] Window [1, 30]](https://hudsonthames.org/wp-content/uploads/2020/05/newplot-14-5.png)
![US Equity CORN-U Rho [-1, 1] Window [1, 30]](https://hudsonthames.org/wp-content/uploads/2020/05/newplot-15-4.png)
![US Equity CORN-K Window [1, 5] Rho [1, 5]](https://hudsonthames.org/wp-content/uploads/2020/05/newplot-16-5.png)
![US Equity SCORN Rho [-1, 1] Window [1, 30]](https://hudsonthames.org/wp-content/uploads/2020/05/newplot-17-4.png)
![US Equity SCORN-K Window [1, 5] Rho [1, 5]](https://hudsonthames.org/wp-content/uploads/2020/05/newplot-18-4.png)
![US Equity FCORN Lambd [0.1, 1000], Rho [-1, 1], Window [1, 30]](https://hudsonthames.org/wp-content/uploads/2020/05/newplot-19-4.png)
